import numpy as np
import matplotlib.pyplot as plt
import pandas as pd
dataset = pd.read_excel("../D2004_1.xlsx", index_col=0)
datasetLoading...
SiO2 = dataset.loc["SiO2"]
SiO2
D2004-1 49.238260
D2004-3 49.355305
D2004-4 57.460235
D2004-5 58.243515
D2004-7 54.643325
D2004-8 53.857485
D2004-10 49.320515
D2004-11 48.952205
D2004-12 52.588875
D2004-13 62.194910
Name: SiO2, dtype: float64SiO2 = dataset.loc["SiO2"]
Al2O3 = dataset.loc["Al2O3"]
Na2O = dataset.loc["Na2O"]
K2O = dataset.loc["K2O"]
MgO = dataset.loc["MgO"]
CaO = dataset.loc["CaO"]
TiO2 = dataset.loc["TiO2"]
P2O5 = dataset.loc["P2O5 "]
FeO = dataset.iloc[8]plt.plot(SiO2, Al2O3, "o")
plt.grid()
plt.ylabel('Al2O3'), plt.xlabel('SiO2')
plt.show()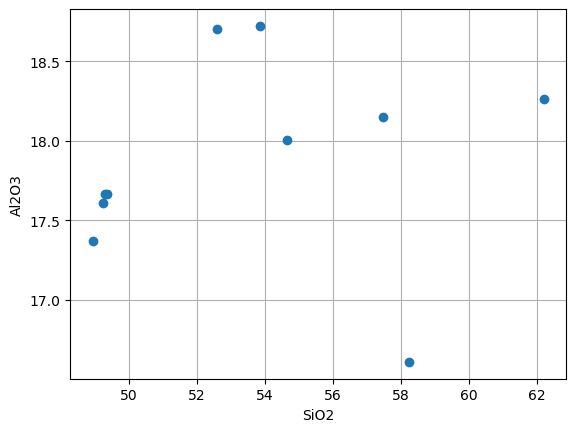
fig, axes = plt.subplots(4, 2, figsize=(10, 14))


# Al2O3
axes[0, 0].plot(SiO2, Al2O3, "o")
axes[0, 0].grid()
axes[0, 0].set_xlabel(r"SiO$_2$")
axes[0, 0].set_ylabel(r"Al$_2$O$_3$")

# MgO
axes[0, 1].plot(SiO2, MgO, "o")
axes[0, 1].grid()
axes[0, 1].set_xlabel(r"SiO$_2$")
axes[0, 1].set_ylabel(r"MgO")

# FeO
axes[1, 0].plot(SiO2, FeO, "o")
axes[1, 0].grid()
axes[1, 0].set_xlabel(r"SiO$_2$")
axes[1, 0].set_ylabel(r"FeO")

# CaO
axes[1, 1].plot(SiO2, CaO, "o")
axes[1, 1].grid()
axes[1, 1].set_xlabel(r"SiO$_2$")
axes[1, 1].set_ylabel(r"CaO")

# Na2O
axes[2, 0].plot(SiO2, Na2O, "o")
axes[2, 0].grid()
axes[2, 0].set_xlabel(r"SiO$_2$")
axes[2, 0].set_ylabel(r"Na$_2$O")

# TiO2
axes[2, 1].plot(SiO2, TiO2, "o")
axes[2, 1].grid()
axes[2, 1].set_xlabel(r"SiO$_2$")
axes[2, 1].set_ylabel(r"TiO$_2$")

# K2O
axes[3, 0].plot(SiO2, K2O, "o")
axes[3, 0].grid()
axes[3, 0].set_xlabel(r"SiO$_2$")
axes[3, 0].set_ylabel(r"K$_2$O")

# P2O5
axes[3, 1].plot(SiO2, P2O5, "o")
axes[3, 1].grid()
axes[3, 1].set_xlabel(r"SiO$_2$")
axes[3, 1].set_ylabel(r"P$_2$O$_5$")


# Adjust layout and show the plot
plt.tight_layout()
plt.show()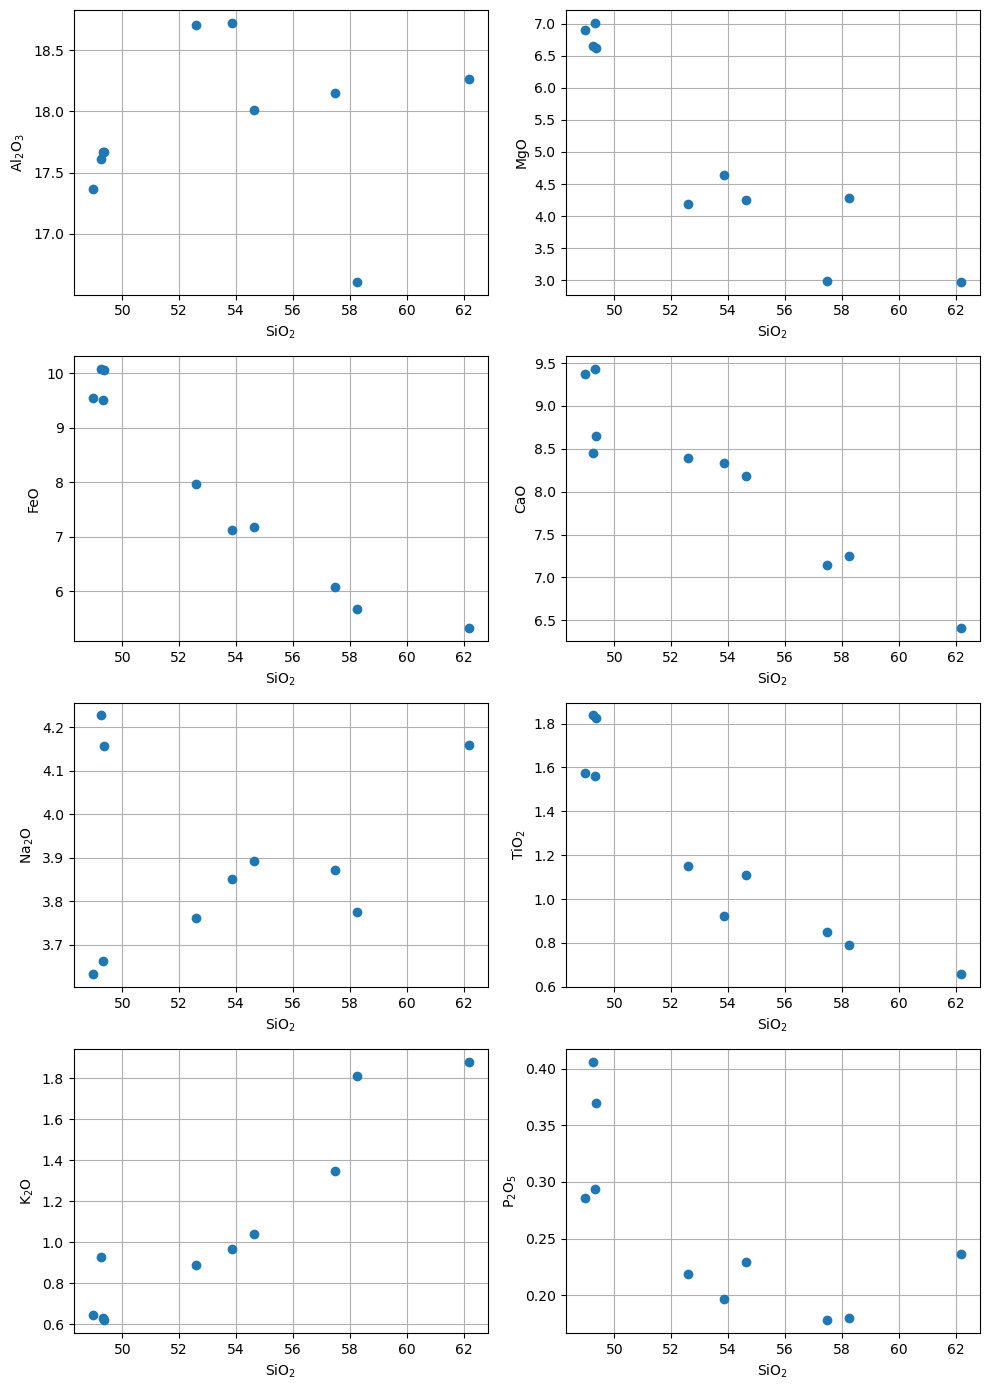
dataset_2 = pd.read_excel("../D2004_2.xlsx", index_col=0)
dataset_2
Loading...
Rb = dataset_2.loc["Rb"]
Sr = dataset_2.iloc[3]
Zr = dataset_2.loc["Zr"]
Nb = dataset_2.loc["Nb"]
Ba = dataset_2.loc["Ba"]
Th = dataset_2.loc["Th"]
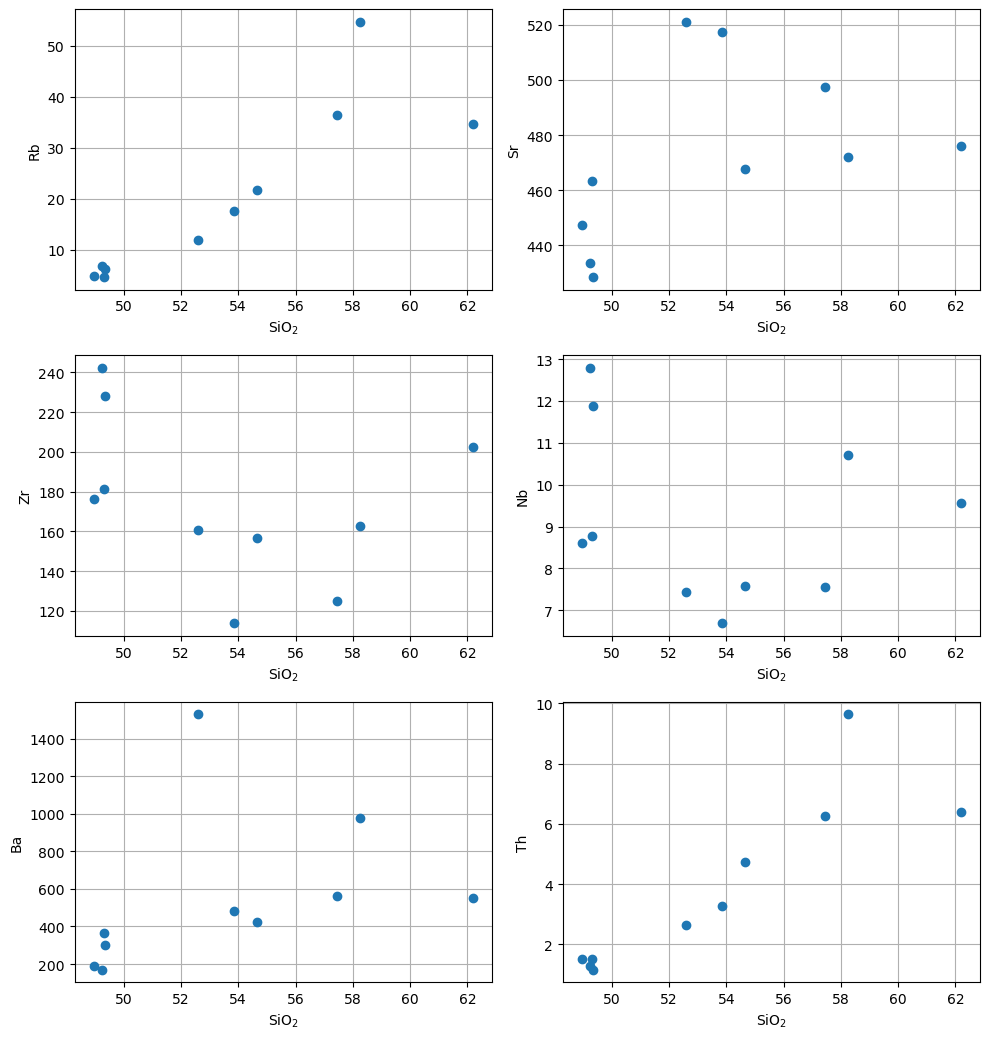
fig, axes = plt.subplots(3, 2, figsize=(10, 10.5))
# Al2O3
axes[0, 0].plot(SiO2, Rb, "o")
axes[0, 0].grid()
axes[0, 0].set_xlabel(r"SiO$_2$")
axes[0, 0].set_ylabel("Rb")
# MgO
axes[0, 1].plot(SiO2, Sr, "o")
axes[0, 1].grid()
axes[0, 1].set_xlabel(r"SiO$_2$")
axes[0, 1].set_ylabel("Sr")
# FeO
axes[1, 0].plot(SiO2, Zr, "o")
axes[1, 0].grid()
axes[1, 0].set_xlabel(r"SiO$_2$")
axes[1, 0].set_ylabel("Zr")
# CaO
axes[1, 1].plot(SiO2, Nb, "o")
axes[1, 1].grid()
axes[1, 1].set_xlabel(r"SiO$_2$")
axes[1, 1].set_ylabel("Nb")
# Na2O
axes[2, 0].plot(SiO2, Ba, "o")
axes[2, 0].grid()
axes[2, 0].set_xlabel(r"SiO$_2$")
axes[2, 0].set_ylabel("Ba")
# TiO2
axes[2, 1].plot(SiO2, Th, "o")
axes[2, 1].grid()
axes[2, 1].set_xlabel(r"SiO$_2$")
axes[2, 1].set_ylabel("Th")
# Adjust layout and show the plot
plt.tight_layout()
plt.show()