import pandas as pd
import numpy as np
import matplotlib.pyplot as plt
dataset_raw = pd.read_excel("./spiderman.xlsx")
dataset_raw.columns = ["Elements"] + list(dataset_raw.columns[1:])
dataset_rawLoading...
sample_names = pd.read_excel("./spiderman.xlsx", index_col=0, header=None)
name_row = sample_names.iloc[0,:].reset_index(drop=True)
name_row
0 D2004-1
1 D2004-3
2 D2004-4
3 D2004-5
4 D2004-7
5 D2004-8
6 D2004-10
7 D2004-11
8 D2004-12
9 D2004-13
Name: Sample, dtype: objectspdr_elements = [
"Cs", "Rb", "Ba", "Th", "U", "Nb", "Ta", "K",
"La", "Ce", "Pb", "Sr", "P", "Nd", "Sm", "Zr",
"Hf", "Eu", "Ti", "Tb", "Y", "Yb", "Lu"
]dataset = dataset_raw[dataset_raw["Elements"].isin(spdr_elements)]
dataset = dataset.set_index("Elements")
dataset = dataset.reindex(spdr_elements)
dataset = dataset.reset_index()
datasetLoading...
reference = pd.read_excel("./reference.xlsx")
reference
Loading...
normalised_dataset = []

for i in range(1, dataset.columns.size):
    calculated = dataset.iloc[:, i] / reference["Primitive Mantle"]
    normalised_dataset.append(calculated)
normalised_df = pd.DataFrame(normalised_dataset).transpose()
normalised_dfLoading...
referenceLoading...
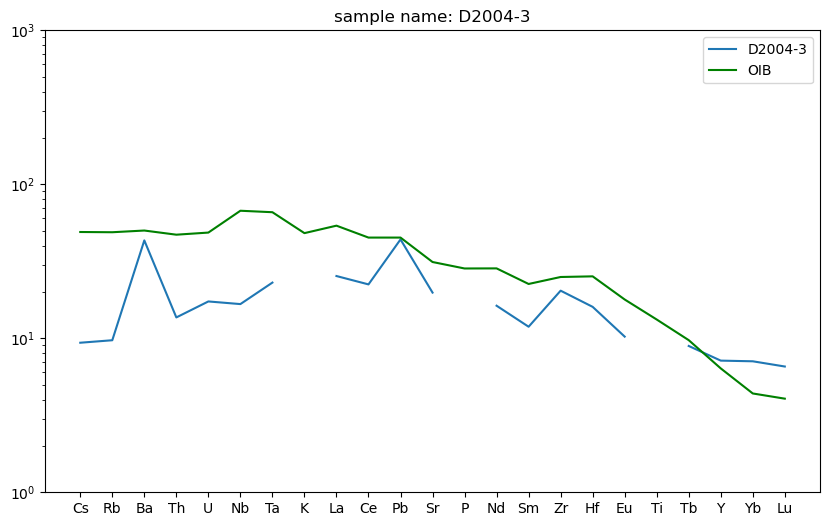
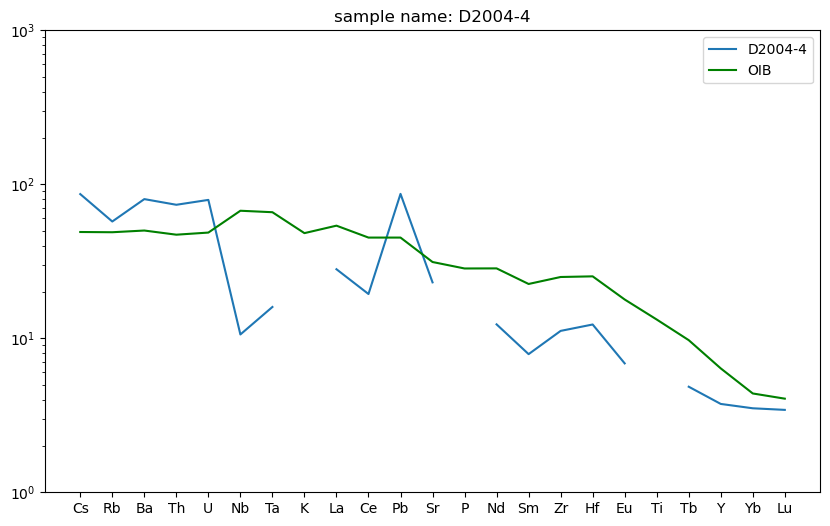
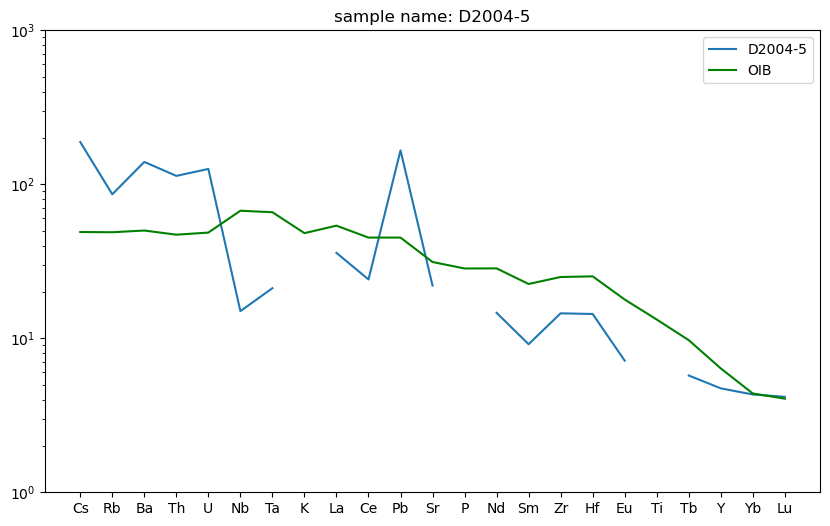
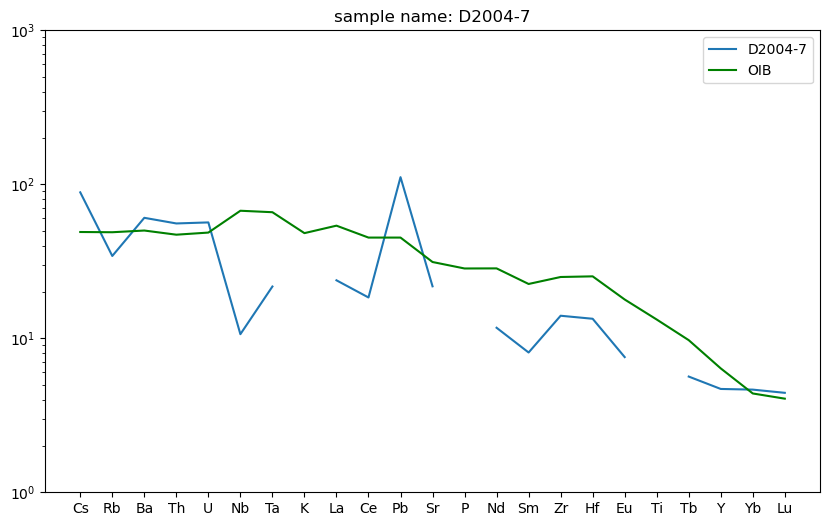
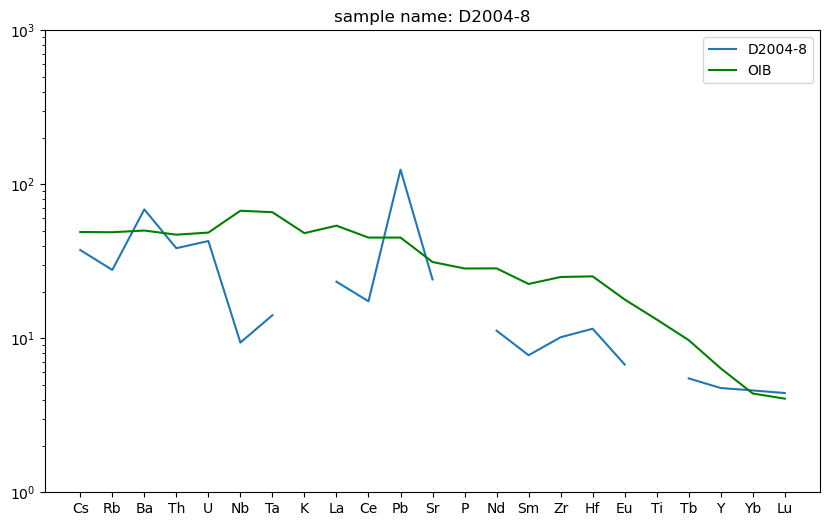
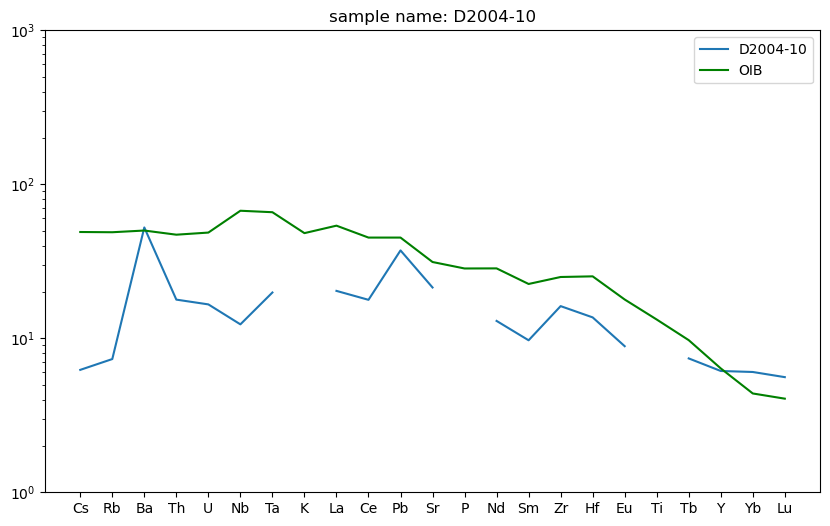
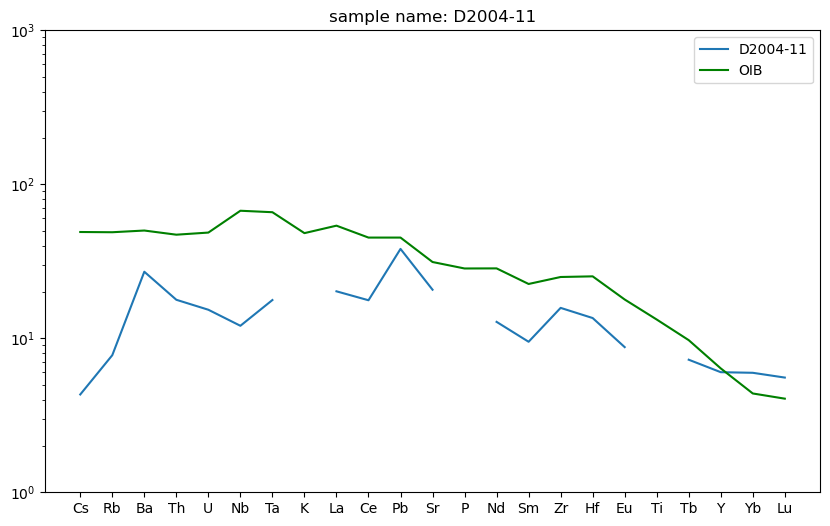
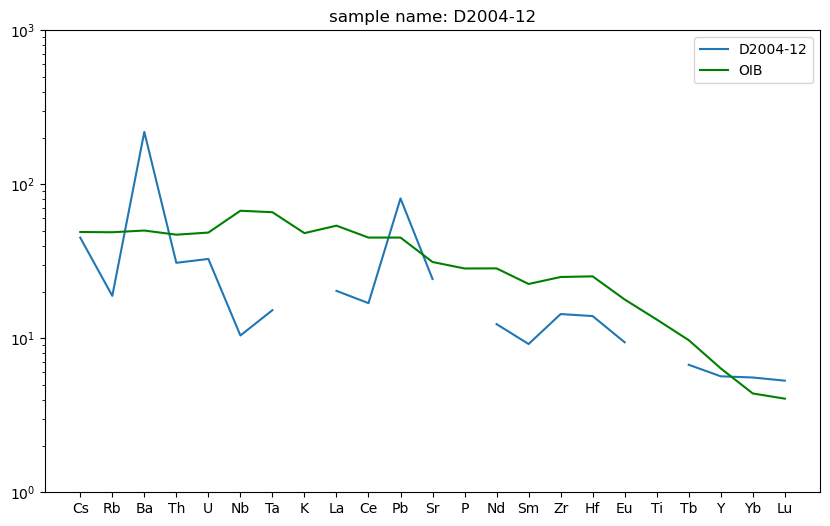
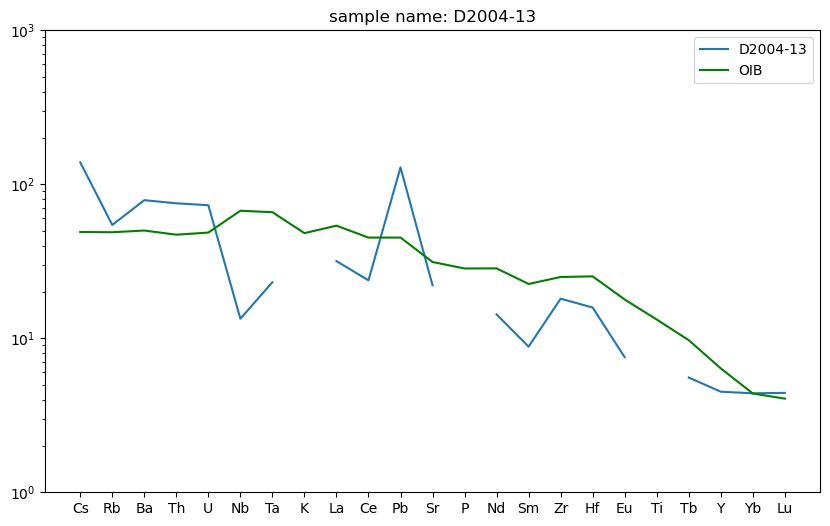
for i in range(normalised_df.columns.size):
    plt.figure(figsize=(10,6))
    plt.plot(dataset["Elements"], normalised_df[i], label=f"{name_row[i]}")
    plt.plot(dataset["Elements"], reference["OIB"], color="green", label="OIB") #OIB
    plt.title(f"sample name: {name_row[i]}")
    plt.yscale('log')
    plt.ylim(1e0,1e3)
    plt.legend()
    plt.show()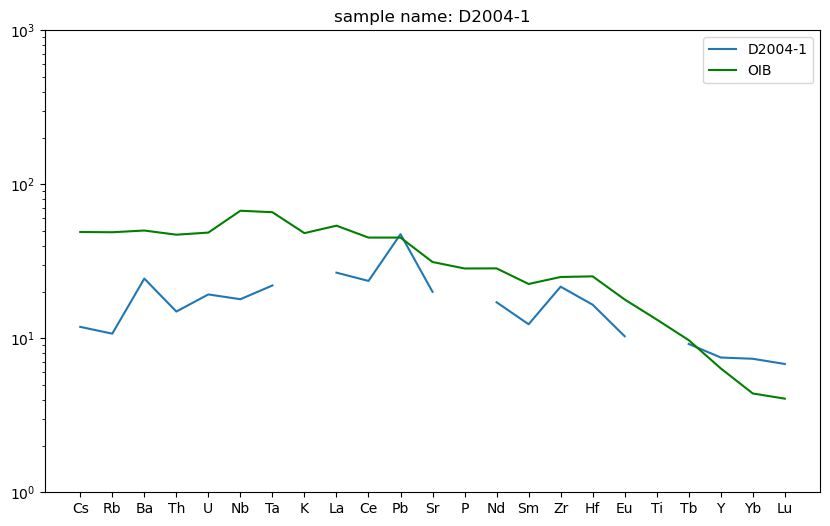
# Create a 2x5 grid of subplots
fig, axes = plt.subplots(5, 2, figsize=(12.5, 17.5))

# Flatten the axes array to make it easier to loop through
axes = axes.flatten()

# Loop through the columns and plot on each subplot
for i in range(normalised_df.columns.size):
    ax = axes[i]  # Get the axis for the current plot
    ax.plot(dataset["Elements"], normalised_df[i], label=f"{name_row[i]}")
    ax.plot(dataset["Elements"], reference["OIB"], color="green", label="OIB") #OIB
    ax.set_title(f"sample name: {name_row[i]}")
    ax.set_yscale('log')
    ax.set_ylim(1e0, 1e3)
    ax.legend()

# Adjust layout to avoid overlap
plt.tight_layout()

# Show the plot
plt.show()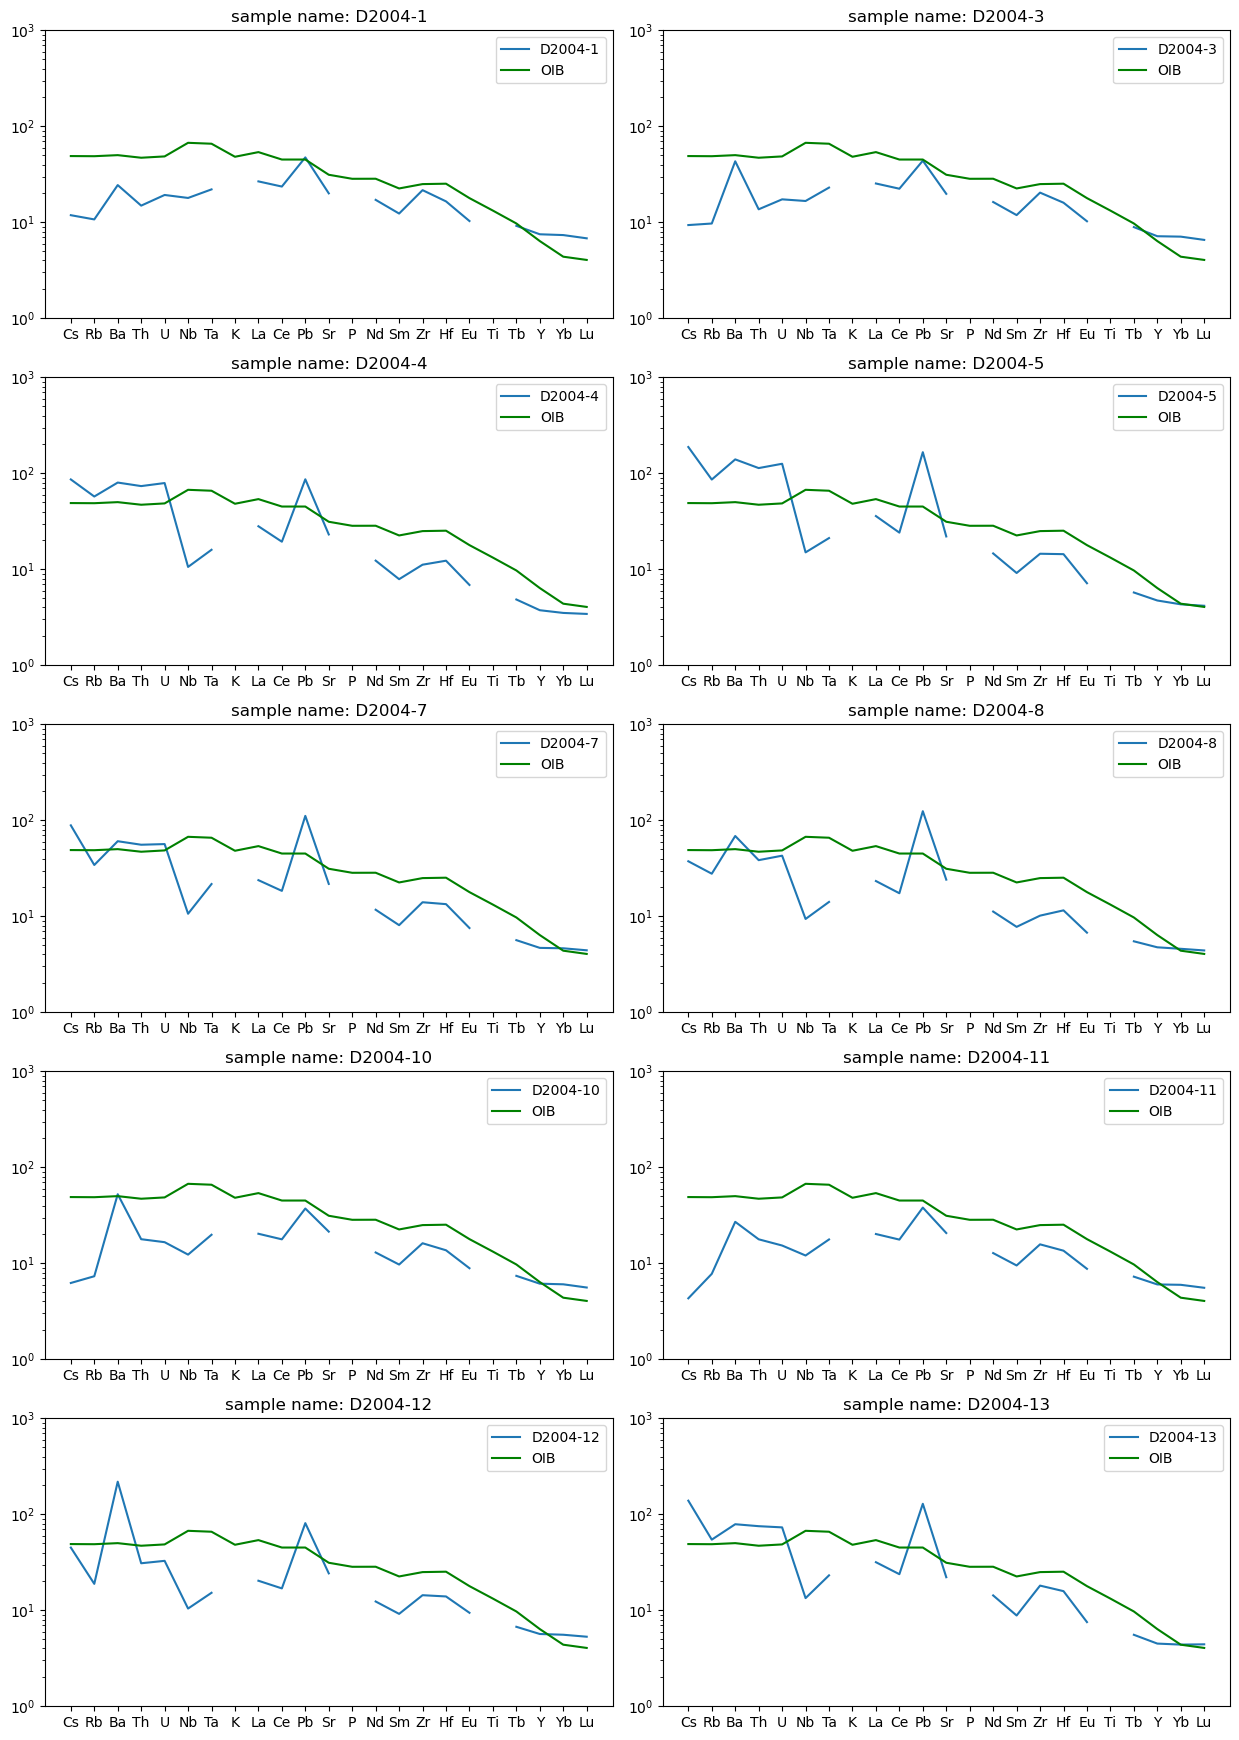
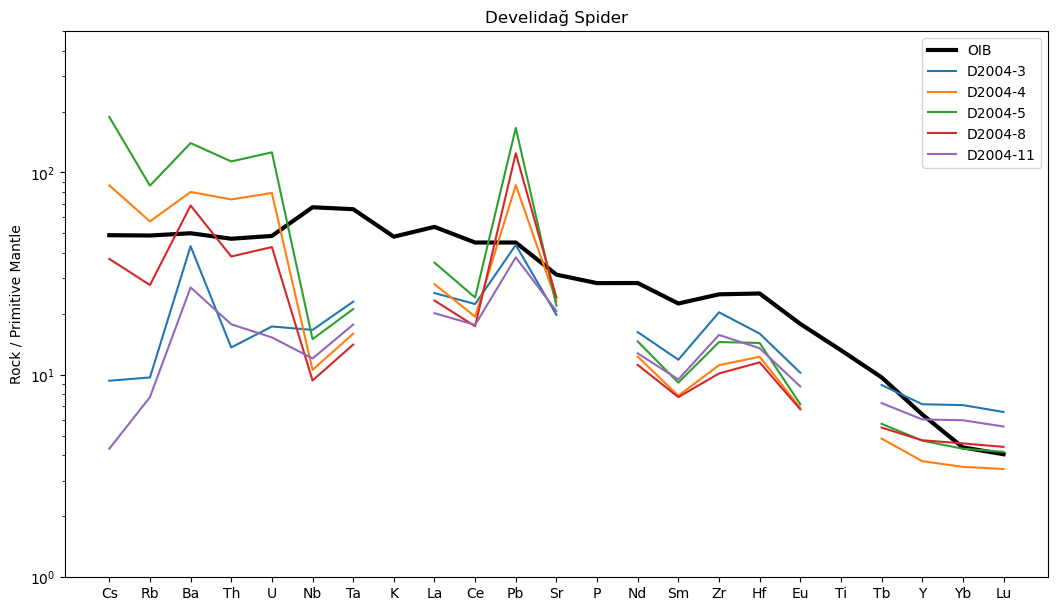
plt.figure(figsize=(10.5,6))

plt.plot(dataset["Elements"], reference["OIB"], color="black", label="OIB", linewidth=3) #OIB

# Loop through the columns and plot on each subplot
#for i in range(normalised_df.columns.size):
#    plt.plot(dataset["Elements"], normalised_df[i], label=f"{name_row[i]}")


plt.plot(dataset["Elements"], normalised_df[1], label=f"{name_row[1]}")
plt.plot(dataset["Elements"], normalised_df[2], label=f"{name_row[2]}")
plt.plot(dataset["Elements"], normalised_df[3], label=f"{name_row[3]}")
plt.plot(dataset["Elements"], normalised_df[5], label=f"{name_row[5]}")
plt.plot(dataset["Elements"], normalised_df[7], label=f"{name_row[7]}")

# Adjust layout to avoid overlap
plt.tight_layout()
plt.yscale('log')
plt.ylim(1e0, 1e3/2)
plt.legend()
plt.title("Develidağ Spider")
plt.ylabel("Rock / Primitive Mantle")
# Show the plot
plt.show()